
Session 26: Performance monitoring
Preparation
- You can download the SwiftVanilla project used in this video tutorial here.
Description
This tutorial examines the use of Performance Monitoring for evaluating differing aspects of performance issues.
Session specific objectives
Using the Performance Monitor.
Chapter 1: Download a demonstration project
- Templates with multiple HD clips
Chapter 2: Performance monitor
- HUD
- Basic and detailed
Chapter 3: Invoking the performance monitor on ICE
- Editing the RTDLLSetup_ch0.xml setup file
Chapter 4: Cue Margin setting in ICE
- Setting the correct frame number
Expected duration
20 minutes
User Level
All new users
Swift Demonstration project
You can download the SwiftVanilla project used in this video tutorial here.
Performance Tests Dialog
Provides tools for testing and diagnosing performance issues within graphics.
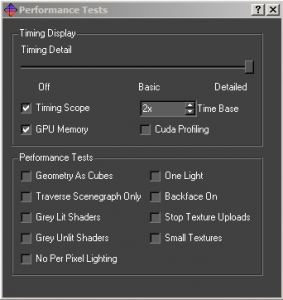
Timing Display
These options change the level of timing detail that is overlaid over the graphics. See the Performance Annotations/HUD section below for more information.
Timing Detail
Off: Do not display any timing data.
Basic: Display basic timing information, suitable for measuring the performance of all graphics.
Detailed: Display comprehensive timing, which contains information that may be necessary to provide RT Software’s support.
Timing Scope
The timing scope provides basic timing information on a line graph.
Time Base
Chooses the zoom level of the timing scope.
GPU Memory
Provides GPU memory resources and allocation available on the graphics card.
Performance Annotations/HUD
When you activate the Timing Display performance options, the viewport will be overlaid with debug information, so it is possible to check the performance of the graphic.
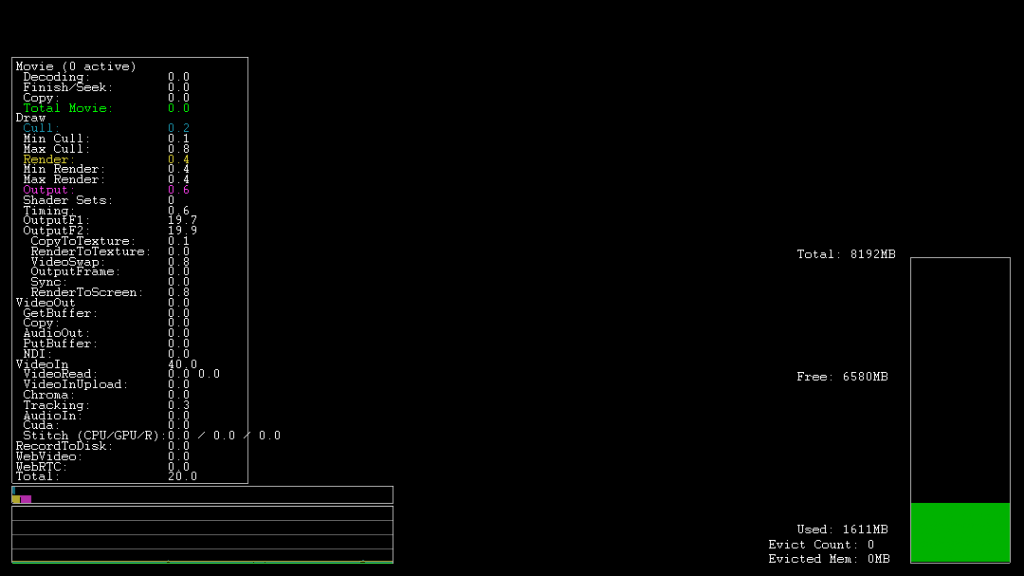
The Timing Scope enabled and the Time Base set to 2. It’s important to remember that the performance you get inside the editor may not be the same as the performance from playout, or other automation tools.
Timing Detail
The list of tasks under “Draw” are stages of the render being completed in milliseconds per frame. The number next to Total is the most important to look at, lower is better.
Finding the target milliseconds per frame are calculated by dividing the target framerate by 1000.
For example 1000/60frames per second gives 16.67ms.
NOTE: Critical values will be highlighted in cyan and yellow.
Bar graph and Timing Scope
The bar graph displays the usage of both the processor (blue) and the graphics card (yellow). Creators should try to keep the bars as far left as possible for the best performance. The timing scope below the bar graph displays the same information but shows it over a span of time, this can be very helpful while playing through methods to determine where any slowdowns are.
Timing and Performance: Performance Tests
The performance tests deliberately disable or change the way the scene renders in order to help find performance problems. For more information look at the Performance Troubleshooting Guide.
Note: The performance tests are only active while the dialog stays open. This is intentional as a safeguard from them being left on by accident.
Geometry as Cubes
Render all geometries as cubes. Tests for geometry complexity bottlenecks, such as dense polygonal meshes.
Note: Although Swift can’t use complex 3D meshes, geometric fonts could cause slowdowns.
Traverse SceneGraph Only
Do not render anything, but traverse the SceneGraph. Tests for SceneGraph complexity bottlenecks.
Grey Lit Shaders
Render all geometries with the same, lit shader. Tests for shader complexity bottlenecks. If this fixes slowdowns it is possible that they were caused by large textures, a lot of textures or complex shaders such as shaders with animations.
Grey Unlit Shaders
Render all geometries with the same, unlit shader. Tests for shader complexity bottlenecks. If this fixes slowdowns then it is possible that it is caused by lights. There may be too many lights in the scene, or too many lights in close proximity to each other.
No Per Pixel Lighting
Turns off all per pixel lighting and Cg Effects. Tests for pixel shader complexity bottlenecks. This is related to Gray Unlit Shaders but test whether per pixel lighting is the cause.
Note: Per Pixel Lighting is disabled in Swift since there is no 3D geometry to render.
One Light
Prevents more than one light being active when rendering. Tests for lighting-related bottleneck issues.
Backface On
Turns back face culling on. Tests whether back face culling has a significant effect on performance.
Stop Texture Uploads
Stops dynamic textures from being uploaded to the graphics card. This includes movies and TMVs. Tests to see if there is a texture upload bottleneck.
Small Textures
Replaces all textures with a single small texture. Tests to see if large textures are causing bottleneck issues.
Note: All of the shaders in Swift are unlit, therefore testing performance with the Grey Lit, Grey Unlit or One Light performance options is unnecessary.
Setup file for rtdll
C:/Program Files/xx/xx/RtswRuntime/RTDLLSetup_
Cue Margin setting
A Cue Margin is set in frames in the ICE Configuration.
An average Cue Margin setting is 50 frames.
Session Project
If you want to review Justin Avery's instructor project at this point in the course, you can download the project zip here.
